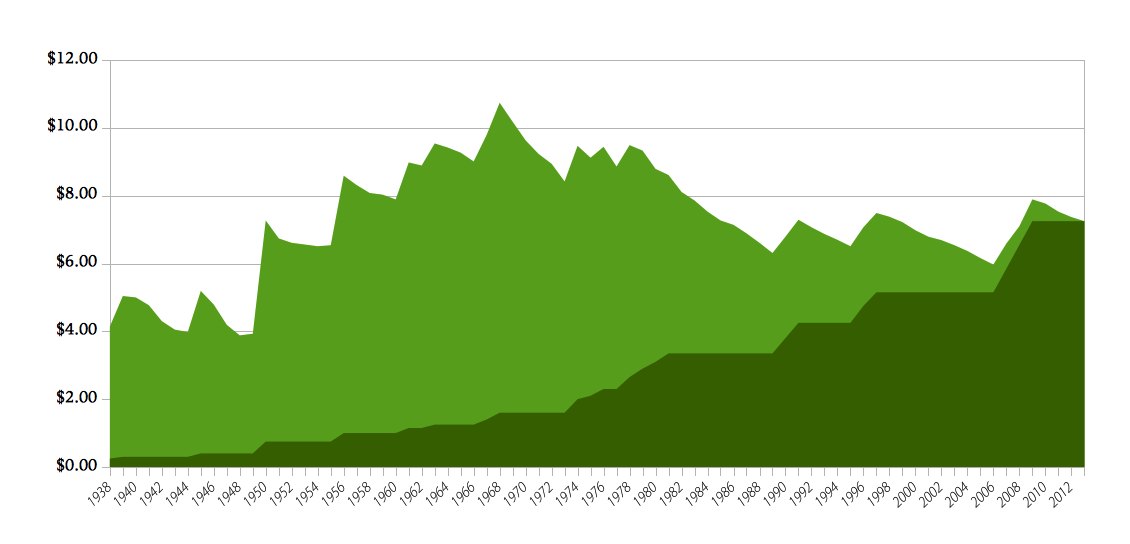
Chart: minimum wage in cost-of-living-adjusted dollars
[wprevive_async zoneid=“1”]
Updated 2021. Originally posted 2013
There has been a lot of talk lately about the minimum wage and how it ought to be raised. It has been claimed that minimum wage workers are making less now than ever and that the nation is in a critical race to the bottom where workers on the low end of the spectrum are getting squeezed harder and harder.
This raises the question of the historical minimum wage in the United States. Is it really lower now than it ever has been? Did America once have a minimum wage that elevated workers from poverty?
Specifically several posts on Facebook and other sites where bad data is the norm rather than the exception, the example of 1968 has been cited. In the old days we did things right, or so goes the narrative. These posts make it sound as though in the 40s, 50s, 60s, 70s and even the 80s that the minimum wage was a plentiful bounty compared to the meager scrap it is today.
So what is the minimum wage when compared to the days of old and adjusted for inflation? This chart uses the data from the Department of Labor and the inflation calculator from the Bureau of Labor Statistics. The minimum wage from each year1 was combined with the price inflation to adjust the values to 20132 dollars.
The first thing that immediately is apparent is that 1968 is an outlier. The adjusted $14.193 minimum wage was unprecedented and has not been seen since. So while the comparisons to 1968 may be entirely accurate, the 1968 numbers ought not be considered representative of the history of the minimum wage.
It is best for this post to stick to the facts. Extrapolating any of this information to an argument for a higher, lower, maintained or even eliminated minimum wage is left as an exercise for the reader. There are only two points of observation I care to add aside from the above mention of 1968.
First, over the long term, the minimum wage seems stable. The large shifts up occurred at 1950 and 1956, and the major decline in adjusted minimum wage occurred in the 80s while the minimum wage remained stable while inflation ate away at its value. Other than those transitions, it seems that the minimum wage generally has adjusted only to compensate for inflation.
Second, over the short term, the adjusted dollar value of the minimum wage always falls. This should not be a surprise. The constant drop of the value of the dollar serves to erode the value of the minimum wage. The wage is adjusted upward to compensate periodically much like prices get raised by retailers to compensate for the loss of value in the dollars their prices were set in.
This apparent conflict should be easily understood but ought to illustrate the causes for the conflict. It is easy at any point to make the case that the minimum wage is either stable or falling — or even rising — depending on what one wants the data to illustrate.
Again, no conclusions are intended from the presentation of this chart. The conversation about the minimum wage is one with legitimate arguments on both sides, but only if those arguments are made with real numbers which are not selected for the purposes of supporting an argument. Hopefully this data shines some light over all perspectives.
Tabular data here for your enjoyment: (original table in footnote)4
| Year | Minimum Wage | Inflation | Inflation multiplier | Wage in 2021 dollars |
|---|---|---|---|---|
| 1938 | $0.25 | -2.1% | 0.0426 | $5.86 |
| 1939 | $0.30 | -1.4% | 0.0420 | $7.13 |
| 1940 | $0.30 | 0.7% | 0.0423 | $7.08 |
| 1941 | $0.30 | 5% | 0.0445 | $6.73 |
| 1942 | $0.30 | 10.9% | 0.0500 | $5.99 |
| 1943 | $0.30 | 6.1% | 0.0533 | $5.63 |
| 1944 | $0.30 | 1.7% | 0.0542 | $5.53 |
| 1945 | $0.40 | 2.3% | 0.0554 | $7.21 |
| 1946 | $0.40 | 8.3% | 0.0605 | $6.61 |
| 1947 | $0.40 | 14.4% | 0.0707 | $5.66 |
| 1948 | $0.40 | 8.1% | 0.0769 | $5.20 |
| 1949 | $0.40 | -1.2% | 0.0760 | $5.26 |
| 1950 | $0.75 | 1.3% | 0.0770 | $9.74 |
| 1951 | $0.75 | 7.9% | 0.0836 | $8.97 |
| 1952 | $0.75 | 1.9% | 0.0852 | $8.80 |
| 1953 | $0.75 | 0.8% | 0.0859 | $8.73 |
| 1954 | $0.75 | 0.7% | 0.0865 | $8.67 |
| 1955 | $0.75 | -0.4% | 0.0862 | $8.70 |
| 1956 | $1.00 | 1.5% | 0.0875 | $11.43 |
| 1957 | $1.00 | 3.3% | 0.0904 | $11.05 |
| 1958 | $1.00 | 2.8% | 0.0931 | $10.74 |
| 1959 | $1.00 | 0.7% | 0.0937 | $10.67 |
| 1960 | $1.00 | 1.77% | 0.0954 | $10.48 |
| 1961 | $1.15 | 1.07% | 0.0964 | $11.92 |
| 1962 | $1.15 | 1.20% | 0.0976 | $11.78 |
| 1963 | $1.25 | 1.24% | 0.0988 | $12.64 |
| 1964 | $1.25 | 1.28% | 0.1001 | $12.48 |
| 1965 | $1.25 | 1.59% | 0.1017 | $12.28 |
| 1966 | $1.25 | 3.02% | 0.1049 | $11.91 |
| 1967 | $1.40 | 2.77% | 0.1079 | $12.97 |
| 1968 | $1.60 | 4.27% | 0.1127 | $14.19 |
| 1969 | $1.60 | 5.46% | 0.1192 | $13.41 |
| 1970 | $1.60 | 5.84% | 0.1266 | $12.63 |
| 1971 | $1.60 | 4.29% | 0.1323 | $12.09 |
| 1972 | $1.60 | 3.27% | 0.1368 | $11.69 |
| 1973 | $1.60 | 6.18% | 0.1458 | $10.97 |
| 1974 | $2.00 | 11.05% | 0.1639 | $12.20 |
| 1975 | $2.10 | 9.14% | 0.1804 | $11.64 |
| 1976 | $2.30 | 5.74% | 0.1914 | $12.02 |
| 1977 | $2.30 | 6.50% | 0.2047 | $11.23 |
| 1978 | $2.65 | 7.63% | 0.2216 | $11.96 |
| 1979 | $2.90 | 11.25% | 0.2497 | $11.61 |
| 1980 | $3.10 | 13.55% | 0.2888 | $10.73 |
| 1981 | $3.35 | 10.33% | 0.3221 | $10.40 |
| 1982 | $3.35 | 6.13% | 0.3432 | $9.76 |
| 1983 | $3.35 | 3.21% | 0.3545 | $9.45 |
| 1984 | $3.35 | 4.30% | 0.3705 | $9.04 |
| 1985 | $3.35 | 3.55% | 0.3841 | $8.72 |
| 1986 | $3.35 | 1.90% | 0.3915 | $8.55 |
| 1987 | $3.35 | 3.66% | 0.4064 | $8.24 |
| 1988 | $3.35 | 4.08% | 0.4237 | $7.91 |
| 1989 | $3.35 | 4.83% | 0.4452 | $7.52 |
| 1990 | $3.80 | 5.40% | 0.4706 | $8.07 |
| 1991 | $4.25 | 4.24% | 0.4915 | $8.65 |
| 1992 | $4.25 | 3.03% | 0.5068 | $8.38 |
| 1993 | $4.25 | 2.95% | 0.5222 | $8.14 |
| 1994 | $4.25 | 2.61% | 0.5362 | $7.92 |
| 1995 | $4.25 | 2.81% | 0.5517 | $7.70 |
| 1996 | $4.75 | 2.93% | 0.5684 | $8.36 |
| 1997 | $5.15 | 2.34% | 0.5820 | $8.85 |
| 1998 | $5.15 | 1.55% | 0.5912 | $8.71 |
| 1999 | $5.15 | 2.19% | 0.6044 | $8.52 |
| 2000 | $5.15 | 3.38% | 0.6256 | $8.23 |
| 2001 | $5.15 | 2.83% | 0.6438 | $8.00 |
| 2002 | $5.15 | 1.59% | 0.6542 | $7.87 |
| 2003 | $5.15 | 2.27% | 0.6694 | $7.69 |
| 2004 | $5.15 | 2.68% | 0.6878 | $7.49 |
| 2005 | $5.15 | 3.39% | 0.7120 | $7.23 |
| 2006 | $5.15 | 3.23% | 0.7357 | $7.00 |
| 2007 | $5.85 | 2.85% | 0.7573 | $7.72 |
| 2008 | $6.55 | 3.84% | 0.7876 | $8.32 |
| 2009 | $7.25 | -0.36% | 0.7847 | $9.24 |
| 2010 | $7.25 | 1.64% | 0.7978 | $9.09 |
| 2011 | $7.25 | 3.16% | 0.8239 | $8.80 |
| 2012 | $7.25 | 2.07% | 0.8413 | $8.62 |
| 2013 | $7.25 | 1.46% | 0.8537 | $8.49 |
| 2014 | $7.25 | 1.62% | 0.8678 | $8.35 |
| 2015 | $7.25 | 0.12% | 0.8688 | $8.34 |
| 2016 | $7.25 | 1.26% | 0.8799 | $8.24 |
| 2017 | $7.25 | 2.13% | 0.8991 | $8.06 |
| 2018 | $7.25 | 2.44% | 0.9216 | $7.87 |
| 2019 | $7.25 | 1.81% | 0.9386 | $7.72 |
| 2020 | $7.25 | 1.2% | 0.95 | $7.63 |
| 2021 | $7.25 | 5% | 1 | $7.25 |
- The year in which the minimum wage was changed each year was used for the entire year regardless of when in the year the change took place. This introduces some inaccuracy to the data as for example the $1.25 minimum wage for 1963 did not take effect until September of that year. Over a period of decades it ought not cause much distortion. ↩
- The original version of this post was based on 2013 dollars ↩
- Original version of this post said $10.74, as it was listing in 2013 dollars. ↩
-
Year Minimum Wage Adjusted 2013 Dollars 1938 $0.25 $4.14 1939 $0.30 $5.04 1940 $0.30 $5.00 1941 $0.30 $4.77 1942 $0.30 $4.30 1943 $0.30 $4.05 1944 $0.30 $3.98 1945 $0.40 $5.19 1946 $0.40 $4.79 1947 $0.40 $4.19 1948 $0.40 $3.88 1949 $0.40 $3.93 1950 $0.75 $7.27 1951 $0.75 $6.74 1952 $0.75 $6.61 1953 $0.75 $6.56 1954 $0.75 $6.51 1955 $0.75 $6.54 1956 $1.00 $8.59 1957 $1.00 $8.31 1958 $1.00 $8.08 1959 $1.00 $8.03 1960 $1.00 $7.89 1961 $1.15 $8.98 1962 $1.15 $8.89 1963 $1.25 $9.54 1964 $1.25 $9.42 1965 $1.25 $9.27 1966 $1.25 $9.01 1967 $1.40 $9.79 1968 $1.60 $10.74 1969 $1.60 $10.18 1970 $1.60 $9.63 1971 $1.60 $9.23 1972 $1.60 $8.94 1973 $1.60 $8.42 1974 $2.00 $9.47 1975 $2.10 $9.12 1976 $2.30 $9.44 1977 $2.30 $8.86 1978 $2.65 $9.49 1979 $2.90 $9.33 1980 $3.10 $8.79 1981 $3.35 $8.61 1982 $3.35 $8.11 1983 $3.35 $7.86 1984 $3.35 $7.53 1985 $3.35 $7.27 1986 $3.35 $7.14 1987 $3.35 $6.89 1988 $3.35 $6.61 1989 $3.35 $6.31 1990 $3.80 $6.79 1991 $4.25 $7.29 1992 $4.25 $7.07 1993 $4.25 $6.87 1994 $4.25 $6.70 1995 $4.25 $6.51 1996 $4.75 $7.07 1997 $5.15 $7.49 1998 $5.15 $7.38 1999 $5.15 $7.22 2000 $5.15 $6.98 2001 $5.15 $6.79 2002 $5.15 $6.69 2003 $5.15 $6.54 2004 $5.15 $6.37 2005 $5.15 $6.16 2006 $5.15 $5.97 2007 $5.85 $6.59 2008 $6.55 $7.10 2009 $7.25 $7.89 2010 $7.25 $7.77 2011 $7.25 $7.53 2012 $7.25 $7.37 2013 $7.25 $7.25
Noticed something
The Bush regimes seem to have been rough times for the minimum wage.
Clarification
You mean the Bush the younger regime. During Bush the elder’s time in office the minimum wage went from $3.35 ($6.31 in 2013 dollars) to $4.25 ($7.07 in 2013 dollars.)
Although I don’t see the evidence for such a statement about Bush the younger, either. In 2001 the minimum wage was $5.15 ($6.98 in 2013 dollars.) In 2006 that same $5.15 was only $5.97 in 2013 dollars, but by the end of 2008 the minimum wage was $6.55 ($7.10 in 2013 dollars.)
I don’t suspect that raising the minimum wage was either Bushes’ idea in any of those cases, but that requires information outside the scope of this data. It’s probably more relevant that in the years in all three Bush terms when the minimum wage increased that Congress was controlled by Democrats.